Learning to Prioritize Risks
Risk management is an important function in organizations today. Companies undertake increasingly complex and ambitious projects, and those projects must be executed successfully, in an uncertain and often risky environment.
As a responsible manager, you need to be aware of these risks. Does this mean that you should try to address each and every risk that your project might face? Probably not – in all but the most critical environments, this can be much too expensive, both in time and resources.
Instead, you need to prioritize risks. If you do this effectively, you can focus the majority of your time and effort on the most important risks.
The Risk Impact/Probability Chart provides a useful framework that helps you decide which risks need your attention.
How to Use the Tool
The Risk Impact/Probability Chart is based on the principle that a risk has two primary dimensions:
- Probability – A risk is an event that "may" occur. The probability of it occurring can range anywhere from just above 0 percent to just below 100 percent. (Note: It can't be exactly 100 percent, because then it would be a certainty, not a risk. And it can't be exactly 0 percent, or it wouldn't be a risk.)
- Impact – A risk, by its very nature, always has a negative impact. However, the size of the impact varies in terms of cost and impact on health, human life, or some other critical factor.
The chart allows you to rate potential risks on these two dimensions. The probability that a risk will occur is represented on one axis of the chart – and the impact of the risk, if it occurs, on the other.
You use these two measures to plot the risk on the chart. This gives you a quick, clear view of the priority that you need to give to each. You can then decide what resources you will allocate to managing that particular risk.
The basic form of the Risk Impact/Probability Chart is shown in figure 1, below.
Figure 1 – The Risk Impact/Probability Chart
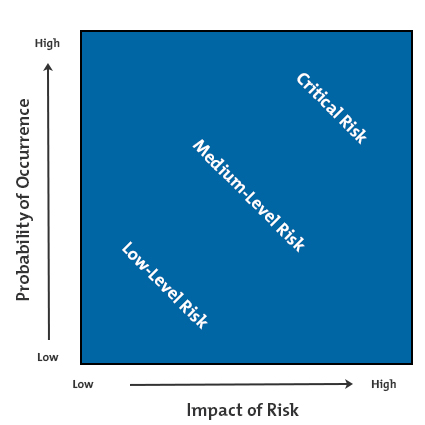
The corners of the chart have these characteristics:
- Low impact/low probability – Risks in the bottom left corner are low level, and you can often ignore them.
- Low impact/high probability – Risks in the top left corner are of moderate importance – if these things happen, you can cope with them and move on. However, you should try to reduce the likelihood that they'll occur.
- High impact/low probability – Risks in the bottom right corner are of high importance if they do occur, but they're very unlikely to happen. For these, however, you should do what you can to reduce the impact they'll have if they do occur, and you should have contingency plans in place just in case they do.
- High impact/high probability – Risks towards the top right corner are of critical importance. These are your top priorities, and are risks that you must pay close attention to.
It's natural to want to turn this into a two-by-two matrix. The problem here is where the lines dividing the quadrants of the matrix lie. For example – should you ignore a 49 percent probability risk, which will cause a 49 percent of maximum loss? And why, in this example, should you pay maximum attention to a risk that has a 51 percent probability of occurring, with a loss of 51 percent of maximum loss?
Tip 2:
In some industries, you need to pay close attention to even very unlikely risks, where these risks involve injury or loss of human life, for example. Make sure you pay due attention to these risks.
- List all of the likely risks that your project faces. Make the list as comprehensive as possible.
- Assess the probability of each risk occurring, and assign it a rating. For example, you could use a scale of 1 to 10. Assign a score of 1 when a risk is extremely unlikely to occur, and use a score of 10 when the risk is extremely likely to occur.
- Estimate the impact on the project if the risk occurs. Again, do this for each and every risk on your list. Using your 1-10 scale, assign it a 1 for little impact and a 10 for a huge, catastrophic impact.
- Map out the ratings on the Risk Impact/Probability Chart.
- Develop a response to each risk, according to its position in the chart. Remember, risks in the bottom left corner can often be ignored, while those in the top right corner need a great deal of time and attention. Read Risk Analysis and Risk Management for detailed strategies on developing a risk response plan.
To successfully implement a project, you must identify and focus your attention on middle and high-priority risks – otherwise you risk spreading your efforts too thinly, and you'll waste resources on unnecessary risk management.
With the Risk Impact/Probability Chart, you map out each risk – and its position determines its priority. High-probability/high-impact risks are the most critical, and you should put a great deal of effort into managing these. The low-probability/high-impact risks and high-probability/low-impact risks are next in priority, though you may want to adopt different strategies for each.
Low-probability/low-impact risks can often be ignored.
Thanks to Mind Tools / Mind Tools Ltd
http://www.mindtools.com/pages/article/newPPM_78.htm#np
| To Get Uninterrupted Daily Article(s) / Review(s) Updates; Kindly Subscribe To This BlogSpot:- http://ZiaullahKhan.Blogspot.com/ Via "RSS Feed" Or " Email Subscription" Or "Knowledge Center Yahoo Group". | ||
| Amazon Magazine Subscriptions | Amazon Books | Amazon Kindle Store |
| Amazon Everyday Low Prices, Sales, Deals, Bargains, Discounts, Best-Sellers, Gifts, Household Consumer Products | ||
No comments:
Post a Comment